Schedule a free demo to learn more

In 2024, U.S. K-12 schools collectively spent an estimated $5 billion on curriculum resources, yet over 60% of teachers still reported having to create or heavily modify lesson plans weekly, a RAND survey noted. This alarming disconnect underscores the urgent need for curriculum visibility, coherence and strategy. As schools in the US gear up for Back-to-School 2025, one question emerges: How much value does a curriculum mapping software generate?
Why Curriculum Mapping is no Longer Optional for Modern Schools
The days of static binders and disconnected spreadsheets are over. Modern classrooms demand cohesion, agility and standards-driven learning experiences. Without curriculum mapping, schools risk misalignment, redundancies and wasted effort. This hinders both teachers and student outcomes. Curriculum mapping software transforms fragmented instructional planning into a unified, dynamic and data-informed process that reflects 21st-century education goals.
1. Instructional Misalignment is costing Instructional Time
RAND’s 2025 analysis highlighted that over 80% of public pre-K teachers juggle multiple curriculum sources, with two-thirds customizing weekly lesson plans, yet fewer than one-third feel they have sufficient planning time. This fragmentation leads to overlapping content, instructional gaps and wasted time.
2. Teachers are financially & emotionally drained
Teachers are spending an estimated $3.24 billion out-of-pocket for classroom materials and still rely on ad-hoc lesson planning. Manual curriculum assembly drains both finances and morale.
3. Misalignment hampers instructional quality and equity
EdReports (2024) showed a disconnect between available high-quality, standards-aligned curricula and what’s actually delivered in classrooms. This inconsistency jeopardizes academic rigor and fairness.
Also Read: What every School Leader should ask before choosing a Curriculum Mapping Software
Curriculum mapping software empowers school leaders to regain control, driving alignment and efficiency across curriculum, assessments and pacing
What Metrics should School Leaders track
To move from anecdotal impact to strategic ROI, school leaders must ground their decisions in data. Tracking the right metrics ensures accountability, promotes buy-in from educators and administrators and helps identify where improvements are most needed. Here are the essential metrics to monitor:
a. Teacher Planning Time Saved
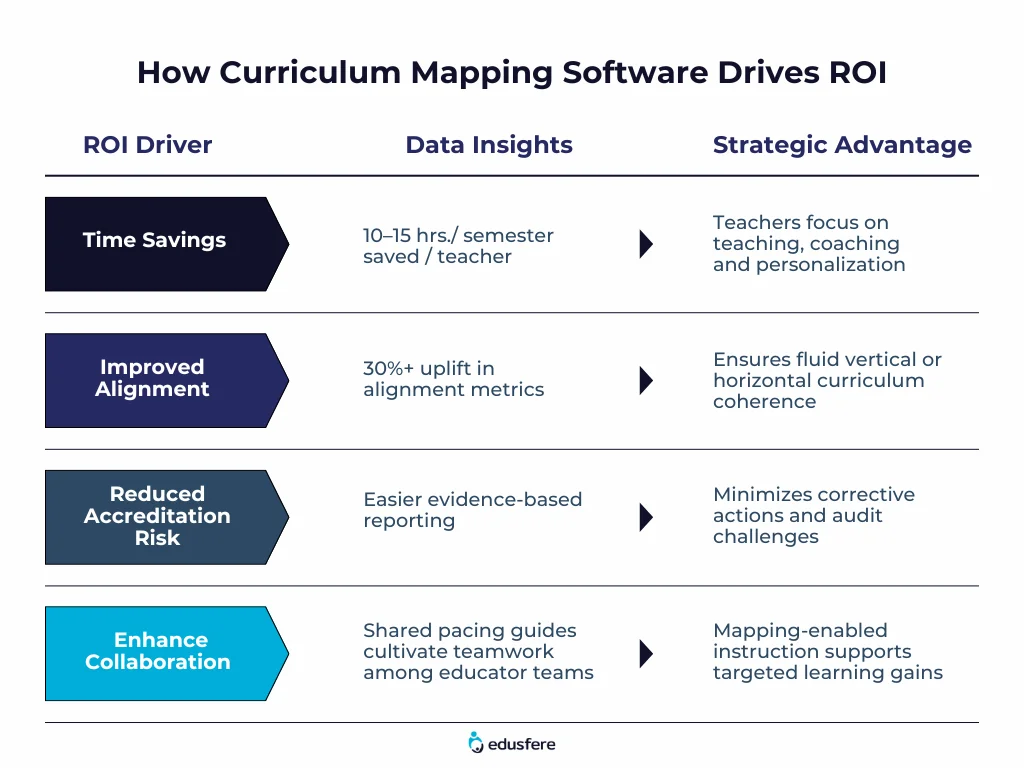
A good curriculum mapping software can save a huge amount of time, otherwise spent in lesson prep and gives educators back hours of critical time for teaching, mentoring or peer collaboration. This aspect is often overlooked but has some remarkable impact on both- the school leaders and educators.
b. Alignment Score
High alignment ensures that what is taught in classrooms maps back to district goals and standards, reducing overlaps and eliminating instructional gaps.
c. Redundancy and Coverage Rates
Tracking these ensures all standards are covered while minimizing repetition. A well-mapped curriculum should maintain <5% redundancy and >98% standards coverage.
d. Accreditation Incidents
Accreditation bodies expect clear curricular evidence. Tracking audit outcomes and corrective actions can signal whether your mapping process is robust.
e. Teacher and Administrator Usage
Satisfaction adoption hinges on usability. Monitoring product usage regularly with pulse surveys can help gauge how well teachers use and understand the tool, driving long-term success.
f. Student Performance Trends
A curriculum that’s strategically mapped should positively influence test scores, engagement levels and overall academic achievement.
These metrics tie directly to the strategic benefits of instructional consistency, operational efficiency and risk mitigation.
How Curriculum Mapping Software works for your ROI
A curriculum mapping software isn’t just a digital upgrade, it’s a strategic lever for achieving institutional goals. By connecting plans, standards and assessments across grade levels and content areas, these platforms bring cohesion and foresight to the curriculum design process. Here’s how they drive direct and indirect ROI:
a. Central Curriculum Repository
No more scattered documents or siloed files. A central hub for all curricular materials improves access, version control and cross-team collaboration.
Also Read: How to choose the right Curriculum Mapping Software for your School
b. Gap and redundancy detection
These automated insights flag missing standards and overlapping lessons, helping you tighten curriculum quality before it impacts the classroom.
c. Real-time reporting for accreditation
On-demand reports that showcase vertical and horizontal alignment streamline compliance reviews and reduce accreditation-related stress.
d. Collaborative planning tools
Teachers can co-develop lessons, align objectives and monitor coverage with shared visibility, fostering instructional consistency.
e. Analytic insights and iteration
School leaders get actionable visuals that inform resource allocation, pacing decisions and interventions that turn insight into impact.
Real-world ROI: Strategic Impact Breakdown
The value of curriculum mapping software becomes even clearer when broken down by measurable returns. From labor savings to improved accreditation outcomes, the strategic payoff is substantial:
a. Time saved is Cost Saved
In a district with 100 teachers, saving 10 hours per semester yields 1,000 teacher-hours per year. At $50/hour, that equates to $50,000 saved, before counting efficiency gains from continuous alignment.
b. Audit protection and liability reduction
With curriculum mapping tools, districts lower accreditation risk, preventing costly corrective actions and preserving educational integrity.
c. Academic Return on Instruction
Analytic-informed curriculum adjustments lead to improved student performance, retention and stakeholder confidence.
Strategic Roadmap to Successful Implementation
1. Baseline First: Measure current alignment, teacher planning time and audit history.
2. Pilot Smart: For very large schools, it can sometimes be helpful to start in a single department or level to refine workflows and measure impact.
3. Scale Confidently: Expand roll‑out once early ROI is documented through metrics and feedback.
4. Benchmark & Iterate: Regularly compare metrics and adjust strategy.
5. Communicate Impact: Share wins with boards, staff, parents and grantors.
6. Sustain with Professional Development (PD): Embed mapping tools into PD cycles to build teacher capacity and buy-in.
ROI is Real, Measurable and Meaningful
As back-to-school 2025 approaches, a curriculum mapping software isn’t just an efficiency play, it’s a strategic investment in instructional excellence. When school leaders pair the right platform with targeted metrics, the ROI becomes clear: teacher empowerment, student growth and institutional resilience.
Ready to see the ROI of Curriculum Mapping in your School?
Edusfere partners with K-12 leaders to simplify curriculum management, improve instructional planning and help schools meet their strategic goals on time, within budget.
Schedule a demo session with Edusfere to discover how we can help you drive measurable impact today.