Schedule a free demo to learn more

From an estimated 169.4 billion USD in 2024 to a projected 598.8 billion USD by 2032, growing at a 17.1% CAGR, schools are investing heavily in digital learning tools. And all of this is in the hope of improving student outcomes, streamlining lesson planning and supporting professional development for teachers.
But here’s the challenge—school budgets are under constant scrutiny, and decision-makers are asking: How do we know this investment is paying off?
For many schools, EdTech ROI feels like a corporate buzzword, best left to analysts or data scientists. But in reality, proving the return on your EdTech stack doesn’t require a Ph.D in analytics. With the right approach, your existing team can connect the dots between technology investments and tangible results including higher test scores, reduced teacher workload or better student engagement.
In this article, we’ll explore practical, accessible strategies for demonstrating EdTech ROI without complicated dashboards or statistical models. You’ll learn how to measure what matters, use curriculum management data effectively and create a clear, evidence-based story that keeps stakeholders confident in your digital strategy.
1. Start with clear, measurable goals for your EdTech Stack
Before you can prove ROI, you need to define what success looks like. For many schools, EdTech purchases are made to solve immediate problems like improving visibility, streamlining grading or providing better teacher resources. But without specific, measurable targets, you won’t have a benchmark for evaluating results.
Actionable steps:
Define 3 to 5 measurable outcomes for each tool in your stack. Here are a few examples:
- Reduce time spent on lesson planning by 20% within six months.
- Improve student formative assessment scores by 10% over the semester.
- Increase teacher participation in professional development programs by 25%.
- Involve teachers and administrators in the goal-setting process to ensure buy-in.
- Align goals with your school’s strategic plan so ROI connects directly to broader priorities.
2. Leverage Curriculum Management data for insight
Your curriculum management system is one of the richest sources of data for measuring ROI. These tools often track lesson plans, assessment results, instructional alignment and teacher engagement. By understanding how the curriculum is being delivered and received, you can identify both qualitative and quantitative signs of value.
How curriculum management data proves ROI:
- Instructional alignment: Track how well lesson plans align with district standards and identify areas of improvement.
- Resource usage: Monitor which teacher resources are being accessed most frequently and which are underutilized.
- Efficiency gains: Compare time spent on planning before and after adoption.
Pro tip: Use the reporting features in your curriculum management platform to create simple visuals including charts and graphs that can be shared with stakeholders, making your ROI story more compelling.
3. Track Teacher Engagement with Curriculum Mapping Software
Curriculum mapping software offers another layer of insight, particularly in how teachers interact with and adapt lesson content over time. Engagement is a leading indicator of ROI. If teachers are actively using the software, customizing resources and sharing best practices, your investment is paying off.
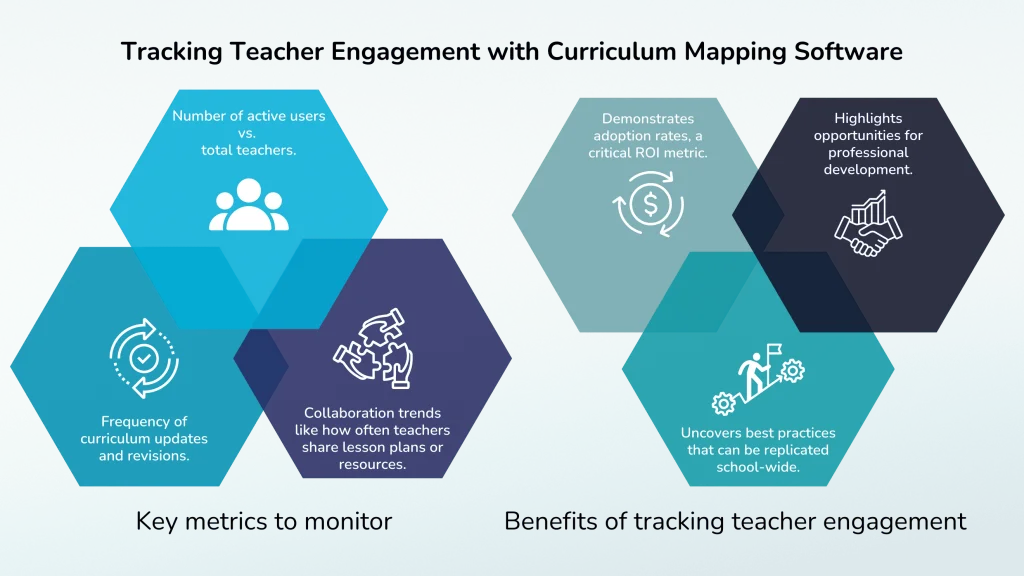
Here are some of the key metrics to monitor:
- Number of active users vs. total teachers.
- Frequency of curriculum updates and revisions.
- Collaboration trends like how often teachers share lesson plans or resources.
Some key benefits of tracking teacher engagement include:
- Demonstrates adoption rates, a critical ROI metric.
- Highlights opportunities for professional development for teachers.
- Uncovers best practices that can be replicated school-wide.
4. Link EdTech Usage to Student Outcomes
Research suggests that students achieved up to a 21% performance increase when their teachers participated in effective training. This underscores how investment in training drives measurable learning gains.
Ultimately, the ROI of your EdTech stack must connect back to the reason it exists: improving student learning. Even without advanced analytics, you can draw meaningful connections between EdTech usage and student performance.
Here are some practical ways to connect the dots:
- Compare pre and post-adoption test scores in targeted subject areas.
- Monitor student engagement metrics from learning platforms (e.g., logins, time on task, completion rates).
- Conduct teacher surveys to capture qualitative data on student participation and comprehension.
For example, if your curriculum mapping software shows consistent alignment to state standards and your assessment data reflects improved mastery rates, you’ve got a strong ROI narrative.
5. Factor in Time and Cost Savings
ROI isn’t just about learning outcomes, it’s also about operational efficiency. The right EdTech tools can save significant time for teachers and administrators, freeing them to focus on instruction and student support.
Some of the key efficiency metrics include:
- Reduction in administrative hours spent on planning and grading.
- Decrease in paper and printing costs due to digital resources.
- Fewer redundant purchases of similar tools.
6. Measure Professional Development Impact
One often-overlooked aspect of EdTech ROI is how it supports professional development for teachers. When tools include embedded training resources, tutorials or communities of practice, they enhance teacher capacity without the need for costly external workshops.
Here’s what to measure:
- Attendance rates for virtual training sessions.
- Teacher satisfaction surveys post-training.
- Observable improvements in lesson delivery and instructional strategies.
Here’s the ROI connection. A more skilled, confident teaching workforce not only benefits students but also improves retention rates, saving costs associated with teacher turnover.
7. Present ROI in a Stakeholder-friendly Format
You might have great data, but if you present it in a 20-page spreadsheet, it’s unlikely to persuade. Stakeholders like school boards, district leaders and parents respond best to clear, concise, visual presentations.
Some of the best practices for presenting your ROI are as follows:
- Use before-and-after visuals to highlight change.
- Combine data points with teacher and student testimonials.
- Focus on 3 to 5 key metrics per presentation to avoid overwhelm.
Proving EdTech ROI with strategy, data and teacher-centric tools
Proving the ROI of your EdTech stack isn’t about mastering complex analytics. It’s about knowing what to measure, capturing the right data and telling a story that resonates with stakeholders. By setting clear goals, leveraging curriculum management and curriculum mapping software data, linking usage to student outcomes and highlighting both cost and time savings, schools can confidently demonstrate the value of their digital investments.
Ready to turn your curriculum into proof of ROI?
Edusfere combines powerful curriculum mapping and management, a robust resource library and embedded professional development. And all of it is purpose-built to help schools measure what matters and prove EdTech ROI with confidence.
Schedule a demo today to explore how we help schools maximize ROI through seamless curriculum management.